
Free Visual Resources
HR Infographics
Visual HR data and benchmarks from Catapult, free to view and share.
Free, No Form
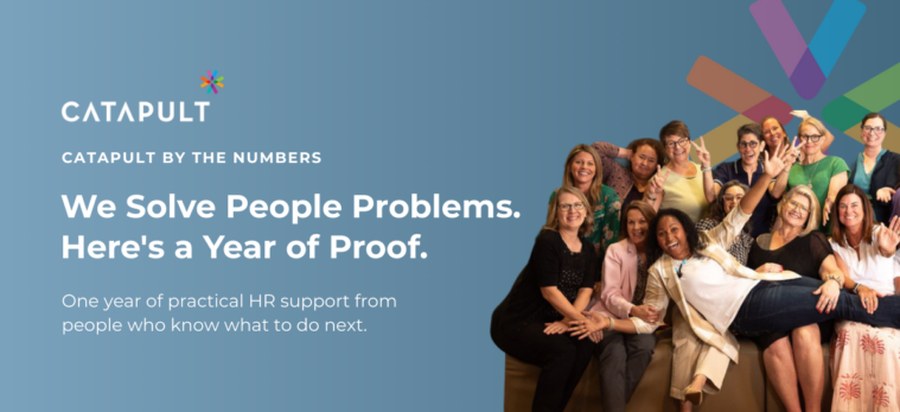
Catapult by the Numbers
A year of Catapult impact in one visual: advisor interactions, screenings, training, and savings. Twelve months of service data on one page, free to view and share.
- 10,000+ HR advisor interactions in twelve months
- 143,947 screening components processed, 28% flagged
- $17,000 average savings per bad hire avoided
- 2,053 professionals trained and 21,633 COBRA claims processed
Unlock With Work Email
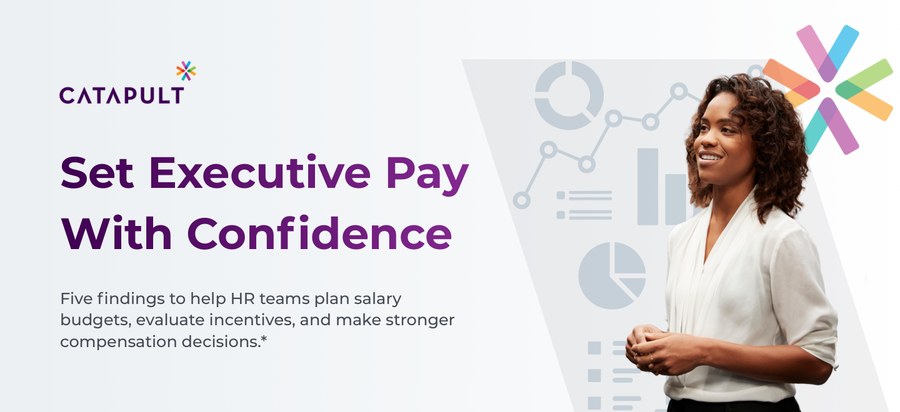
2026 Executive Compensation Survey
Five findings on executive pay, bonus design, and CEO benchmarks from the 2026 National Executive Compensation Survey. Add your work email to unlock all five figures and download the PDF.
- How far executive base pay moved this year
- How bonus plans are built and what drives payouts
- How company size changes the CEO pay benchmark
- How common long-term incentives are among senior roles